Data visualisation
Networks tell a story in a visual way. Relationships reveal hidden information in our data.
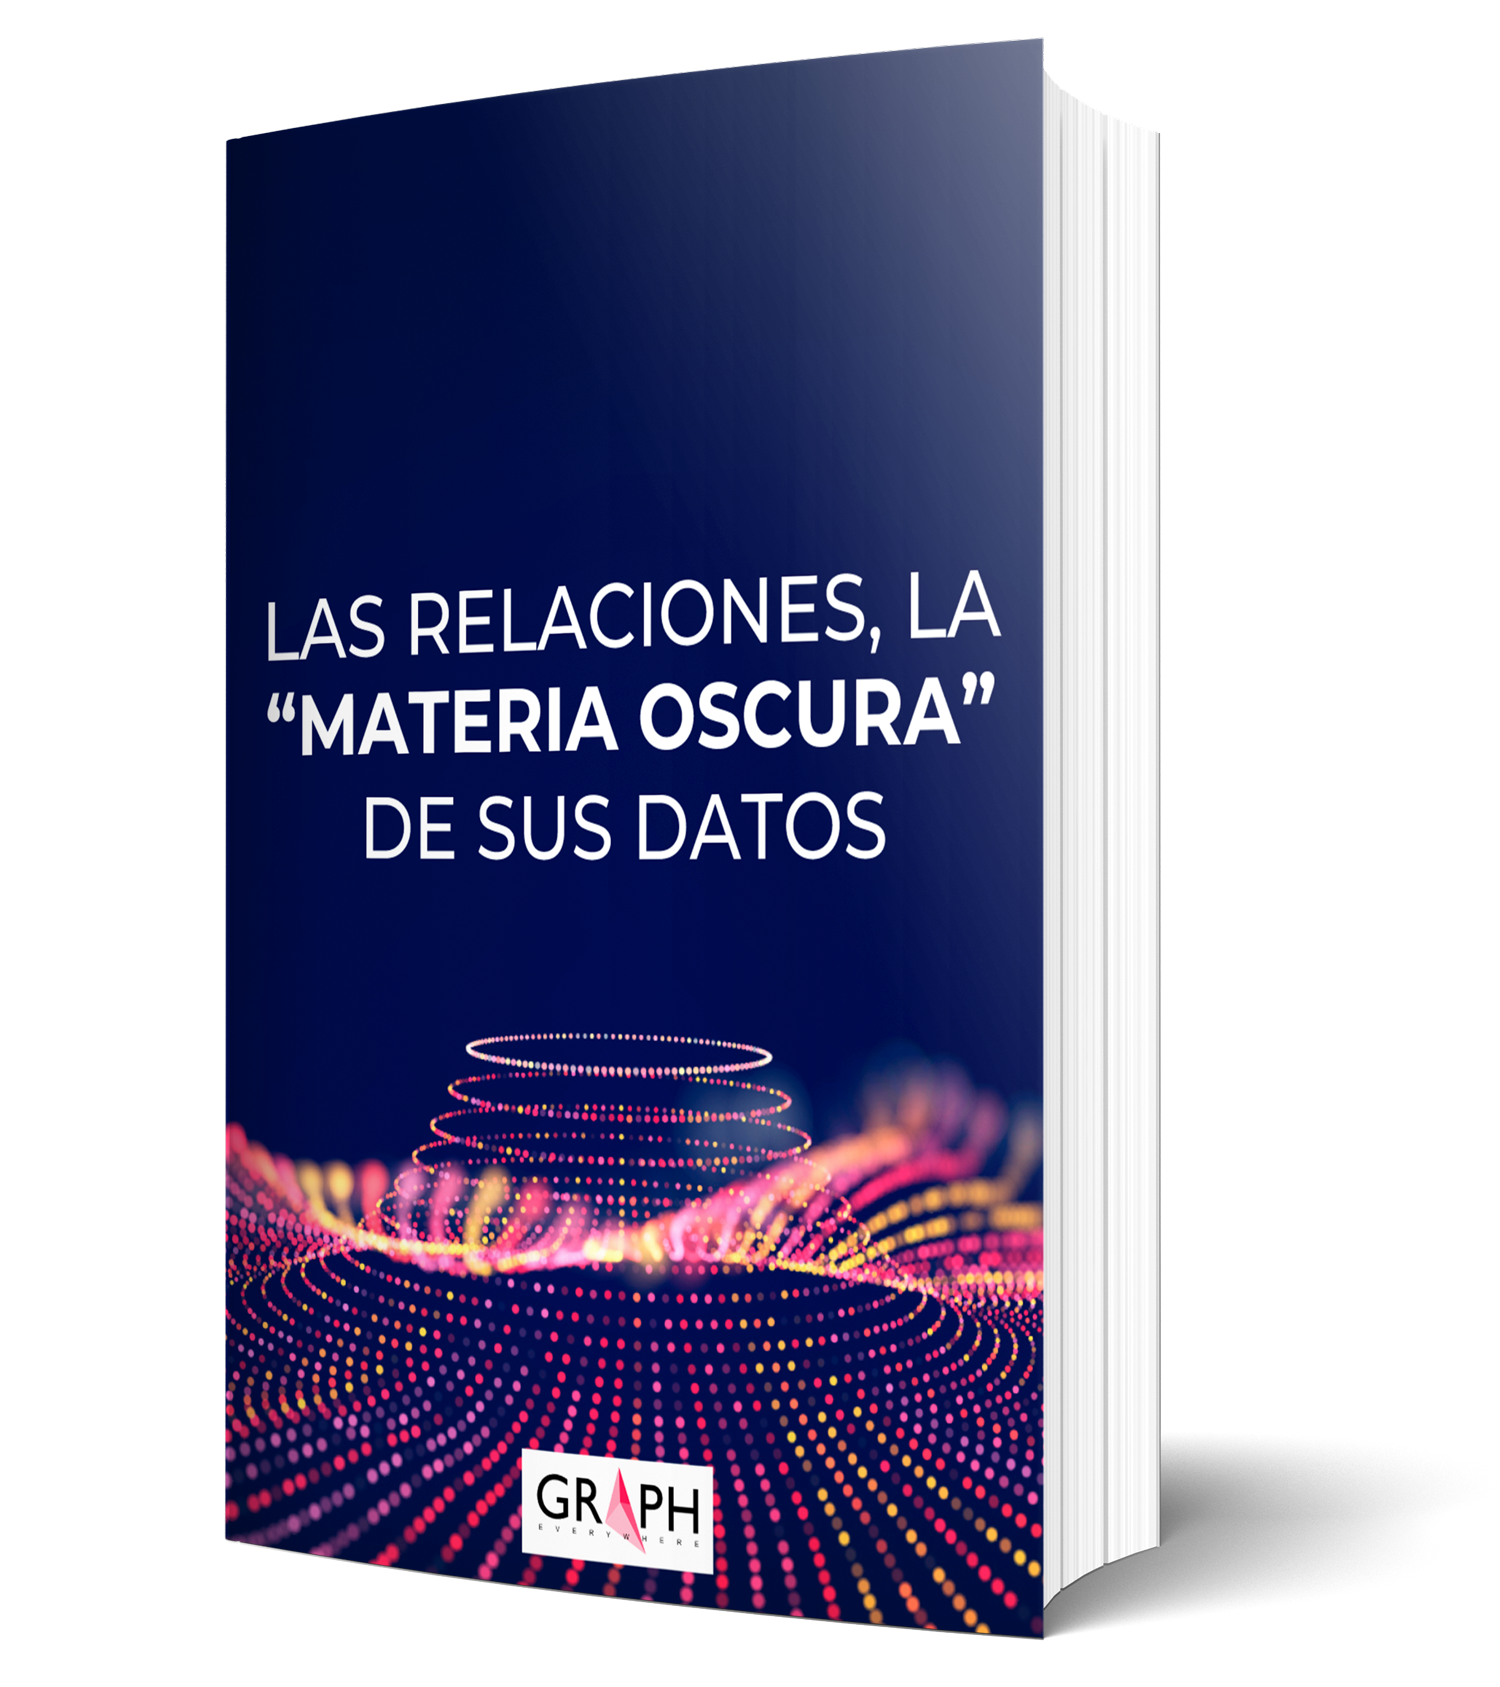
Download for FREE our latest ebook: “Relationships, the “Dark Matter” of your data”.
A New Data Visualisation
Data visualisation takes on a new dimension when we use the relationships between data in an intelligent way.
We can detect communities, understand how our customers relate to each other, improve our network understanding or detect business pain points by seeing a powerful graphical representation of the data we already have.
Not all users require the same level of visual interaction with data. We use the best visual tools such as Bloom, Linkurious or Gephi in a smart way to provide the best visual experience for every need.
Graphs and maps
The geolocation of the data together with the visual representation of the graph brings a new understanding of the data.
Visual scanning
It is important to provide navigation and visual exploration capabilities to business users.
Visualisation and Machine Learning
We generate the information required by SEPBLAC automatically. Complying with the regulator and delivering maximum value at the same time.
What do we want to achieve?
Improving data visualisation
We design and implement the visual data representation solution that best meets the business need.
We use the best tools to provide exploration functionality, the creation of powerful visual reports, or the presentation of massive data on data networks and relationships…
What challenges will we face?
Large volumes of data
Visualising 10 nodes is not the same as visualising 10,000.
How we use the data says a lot about the visual solution we want to implement, and our team specialises in bringing these challenges to life.
What are the benefits?
Improving productivity
We are looking for the WOW! … and we got it.
Data tells stories visually, users increase the productivity of their analysis and research processes.
We take a step forward in the visual management of data.

Relationships, the “Dark Matter” of your data
Download the FREE eBook that will change the way you understand your company’s information.
Ready
Let’s turn your data into relevant information for your business. Let’s explore together graph solutions for your databases and apply Neo4j technology among others.
